




PDF reports and a weekly summary by email
Create reports per customer, with your logo on them.
Want to see how it works?
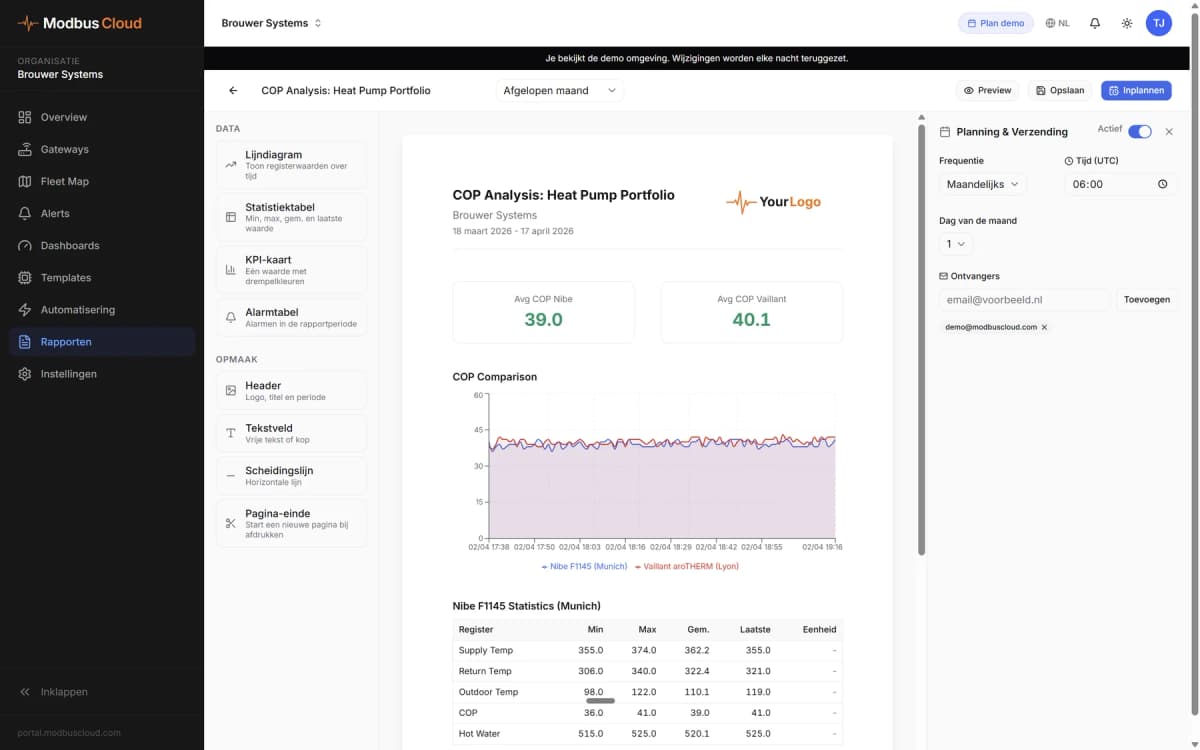
A report per customer or site
Choose the registers and the period, and the portal turns them into a PDF.
- Content
- Charts and tables of the registers you choose
- Layout
- With your logo on it
- Weekly summary
- A summary by email every week
ReportFamilie Schreiber
- Content
- Heat pump COP
- Period
- Last month
- Save
- As PDF
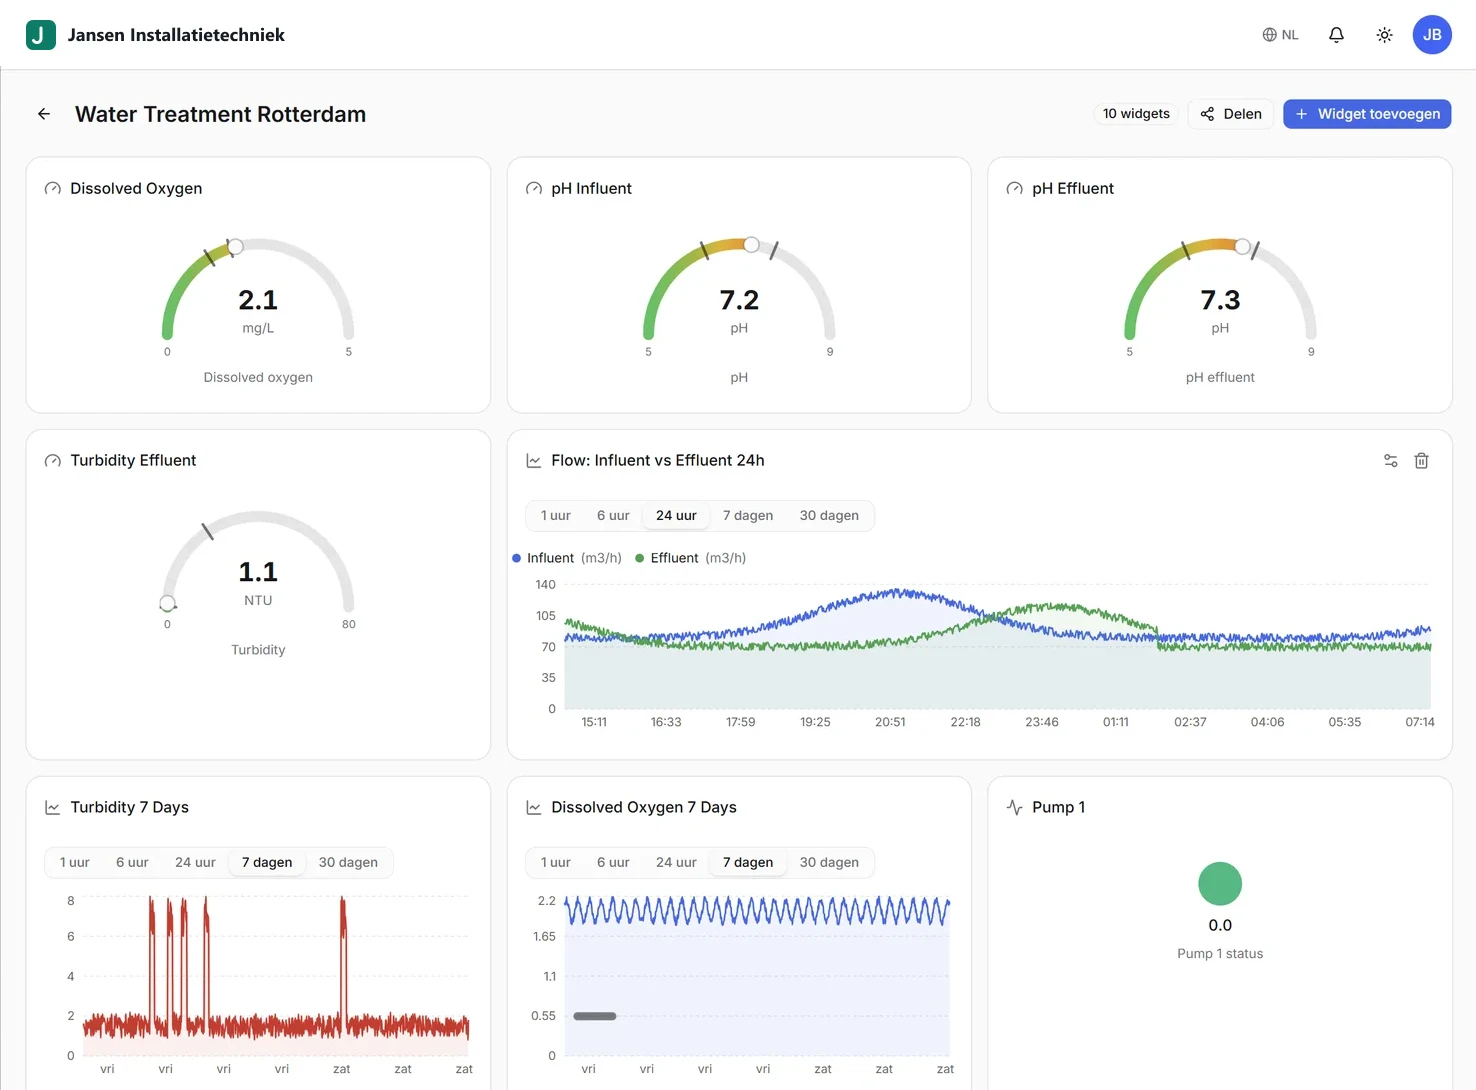
Reports in the customer portal
Your customer sees the dashboards and reports you set up, in a portal with your logo.
- View
- Open the reports you set up and save them as PDF
- Own reports
- If you allow it, your customer can create their own reports
- Link
- You can also share a dashboard via a link
More in the portal
Want to see how it works?