



my-PV WiFi Meter (grid)
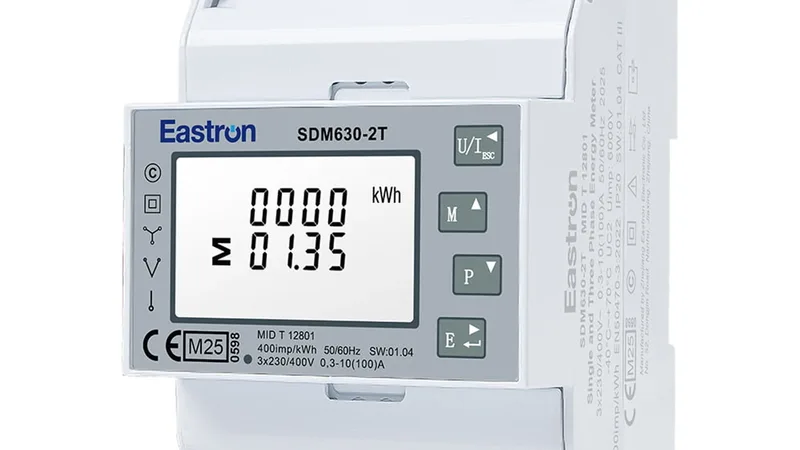
The my-PV WiFi Meter is a three-phase grid-connection meter designed for PV self-consumption monitoring in residential and light-commercial installations. Mounted in the distribution cabinet after the utility meter, it uses clamp-on current transducers to measure grid power flow without interrupting the phases. Over Modbus TCP (port 502, device ID 1), the template reads total active power and cumulative energy at the grid point, plus per-phase currents and active power for phases A, B, and C. This gives installers and building owners precise, phase-resolved visibility into import and export flows directly in the ModbusCloud portal.
- Protocol
- Modbus TCP
- Connection
- Ethernet, Modbus TCP
- Registers
- 8, read only
- Brand
- my-PV
- Last updated
Registers (8)
8 read, 0 write
| Name | Unit | Access | Address (Hidden until you enter your email) | Function (hidden) | Type (hidden) |
|---|---|---|---|---|---|
| power | W | Read | |||
| energy | Wh | Read | |||
| currents_a | A | Read | |||
| currents_b | A | Read | |||
| currents_c | A | Read | |||
| powers_a | W | Read | |||
| powers_b | W | Read | |||
| powers_c | W | Read |
Loading registers…
Send your device list
If a device is not in the library yet, we build the template for free as soon as we have the register data.
Use cases
- Monitor total grid import and export power in real time to verify PV self-consumption performance on each site.
- Track per-phase active power on phases A, B, and C to detect load imbalances across the three-phase installation.
- Alert on sustained grid import above a defined threshold to identify unexpected consumption patterns or device faults.
- Compare cumulative energy readings over time to report on grid consumption trends for building management.
- Verify that clamp-on CT readings on all three phases are consistent after installation to confirm correct sensor placement.
Installation
Mount the my-PV WiFi Meter in the distribution cabinet directly after the utility meter, then connect the three clamp-on current transducers to terminals UA, UB, and UC before clamping them onto the phase conductors.
Connect the meter to your local Wi-Fi network using the my-PV web interface; confirm the green RUN LED and red WIFI LED are both lit, indicating power and network connectivity.
In the ModbusCloud portal, add the ModbusCloud Gateway to the same LAN as the my-PV WiFi Meter, then import this template and assign device ID 1 with port 502 as the target endpoint.
Verify the connection by spot-checking the live value of the power register (address 32): it should reflect the current grid import or export visible on your utility meter.
Things to watch for
Why do the current and power registers show values roughly two or three times too high?
The my-PV WiFi Meter does not automatically correct readings when non-standard CT sizes are used. If you installed 200A or 400A clamp-on transducers instead of the default 75A units, you must manually apply the CT correction factor. For 200A CTs, multiply raw values by 200/75 = 2.6667. Check the CT size installed and apply the corresponding factor.
The Gateway connects but all register values read zero or show errors. What should I check?
Confirm the meter's WIFI LED is lit red, indicating an active WLAN connection. Verify the Gateway is on the same subnet as the meter. Check that device ID 1 and port 502 are set in the portal. If the meter recently lost Wi-Fi (e.g. after a router restart), power-cycle the meter to restore connectivity.
Phase A shows power but phases B and C read zero. Is the template misconfigured?
This almost always means one or two clamp-on CTs are not correctly seated around their phase conductor, or are connected to the wrong CT terminal on the meter. Re-check that each transducer is clamped firmly around a single phase wire and wired to its corresponding terminal (UA, UB, UC) on the meter body.
The power register alternates between positive and negative unexpectedly. Is this normal?
The total power register (address 32) is a signed int32, where positive values indicate grid import and negative values indicate export. Rapid sign changes simply reflect the PV system transitioning between import and export. If the transitions seem implausible, check that the CT clamps are oriented in the same direction on all three phases, as a reversed CT will invert the sign.
Want to see how it works?