

All topics
On this page
A dashboard puts values from several gateways and Modbus devices together on one screen. It belongs to your organisation, so every team member finds it under Dashboards. You show it to someone without an account through Share a dashboard with a link. The values of one gateway are already on the gateway page, as described in View values and charts.
What you need
- The role Owner, Admin or Technician in your organisation. With Read only you view dashboards but cannot create them.
- Modbus devices that already return values. How to add them is described in Add Modbus devices.
Create a new dashboard
Loading the walkthrough.
After these steps, an empty dashboard is on your screen.
Open Dashboards
Open Dashboards in the menu.
Start creating
Click New dashboard at the top right. The New dashboard window opens.
Enter the name
In Name, enter a name, such as Cold rooms Berlin.
Enter a description
If you want a short explanation on the card in the list of dashboards, fill in Description.
Save the dashboard
Click Create dashboard. The empty dashboard opens with the message No widgets.
Add a widget
After these steps, a new widget is at the end of the dashboard. It shows nothing until you configure it.
Start adding
Click Add widget at the top right. On an empty dashboard, Add first widget in the middle also works.
Enter the name
In Name, enter the name of the widget, such as Freezer temperature. The name appears at the top of the widget.
Choose the type
Under Type, choose how the widget shows the values, such as Chart. Point at a type with the mouse for a preview.
Place the widget
Click Add. The new widget shows Click to configure.
Choose registers
In the Configure widget window, you choose which registers the widget shows and how. The fields depend on the type.
Open the window
Click Click to configure in the widget. The Configure widget window opens.
Enter a description
If you want an explanation under the name of the widget, fill in Description. There is one line per language. An empty line uses the text from another language.
Open the register list
Click the register field. For a type with several registers, such as Chart, it is under Add register. For most other types, it is under Register.
Choose the gateway
Choose the gateway. In Search gateway..., type part of the name, the serial number or the customer to shorten the list.
Choose the Modbus device
Choose the Modbus device.
Choose the register
Choose the register. In a chart, you add up to 10 registers this way, including registers of other gateways.
Set the display
Set the other fields, such as Unit or Default time window. An empty field uses the default value, such as the unit of the register.
Save the widget
Click Save. The widget now shows the values.
As long as no register is chosen, Save does not work. A few types differ. Gateway status only asks for a gateway, Scatter plot asks for two registers and Text asks for the text itself. A Pie chart with Gateways by status asks for nothing.
Update widgets and the dashboard
The portal saves every change on the dashboard straight away. Point at a widget with the mouse. Four buttons appear at the top right of the widget.
- The handle with six dots (Drag to move). Drag the widget to another position.
- The double arrow (Width). Choose Narrow (1/3), Wide (2/3) or Full width.
- The icon with two sliders. The Configure widget window opens.
- The bin. The widget disappears from the dashboard.
Click the name of the dashboard at the top to change it. Press Enter to save the new name.
Each card in the list under Dashboards has two more buttons. The icon with the two squares (Make a copy) makes a copy of the dashboard. The bin deletes the whole dashboard, after you click Bevestigen (Confirm).
Widget types
In the Add widget window, the types are in two groups. Under Read are the widgets that show values. Under Write are the widgets that send a value to a register.
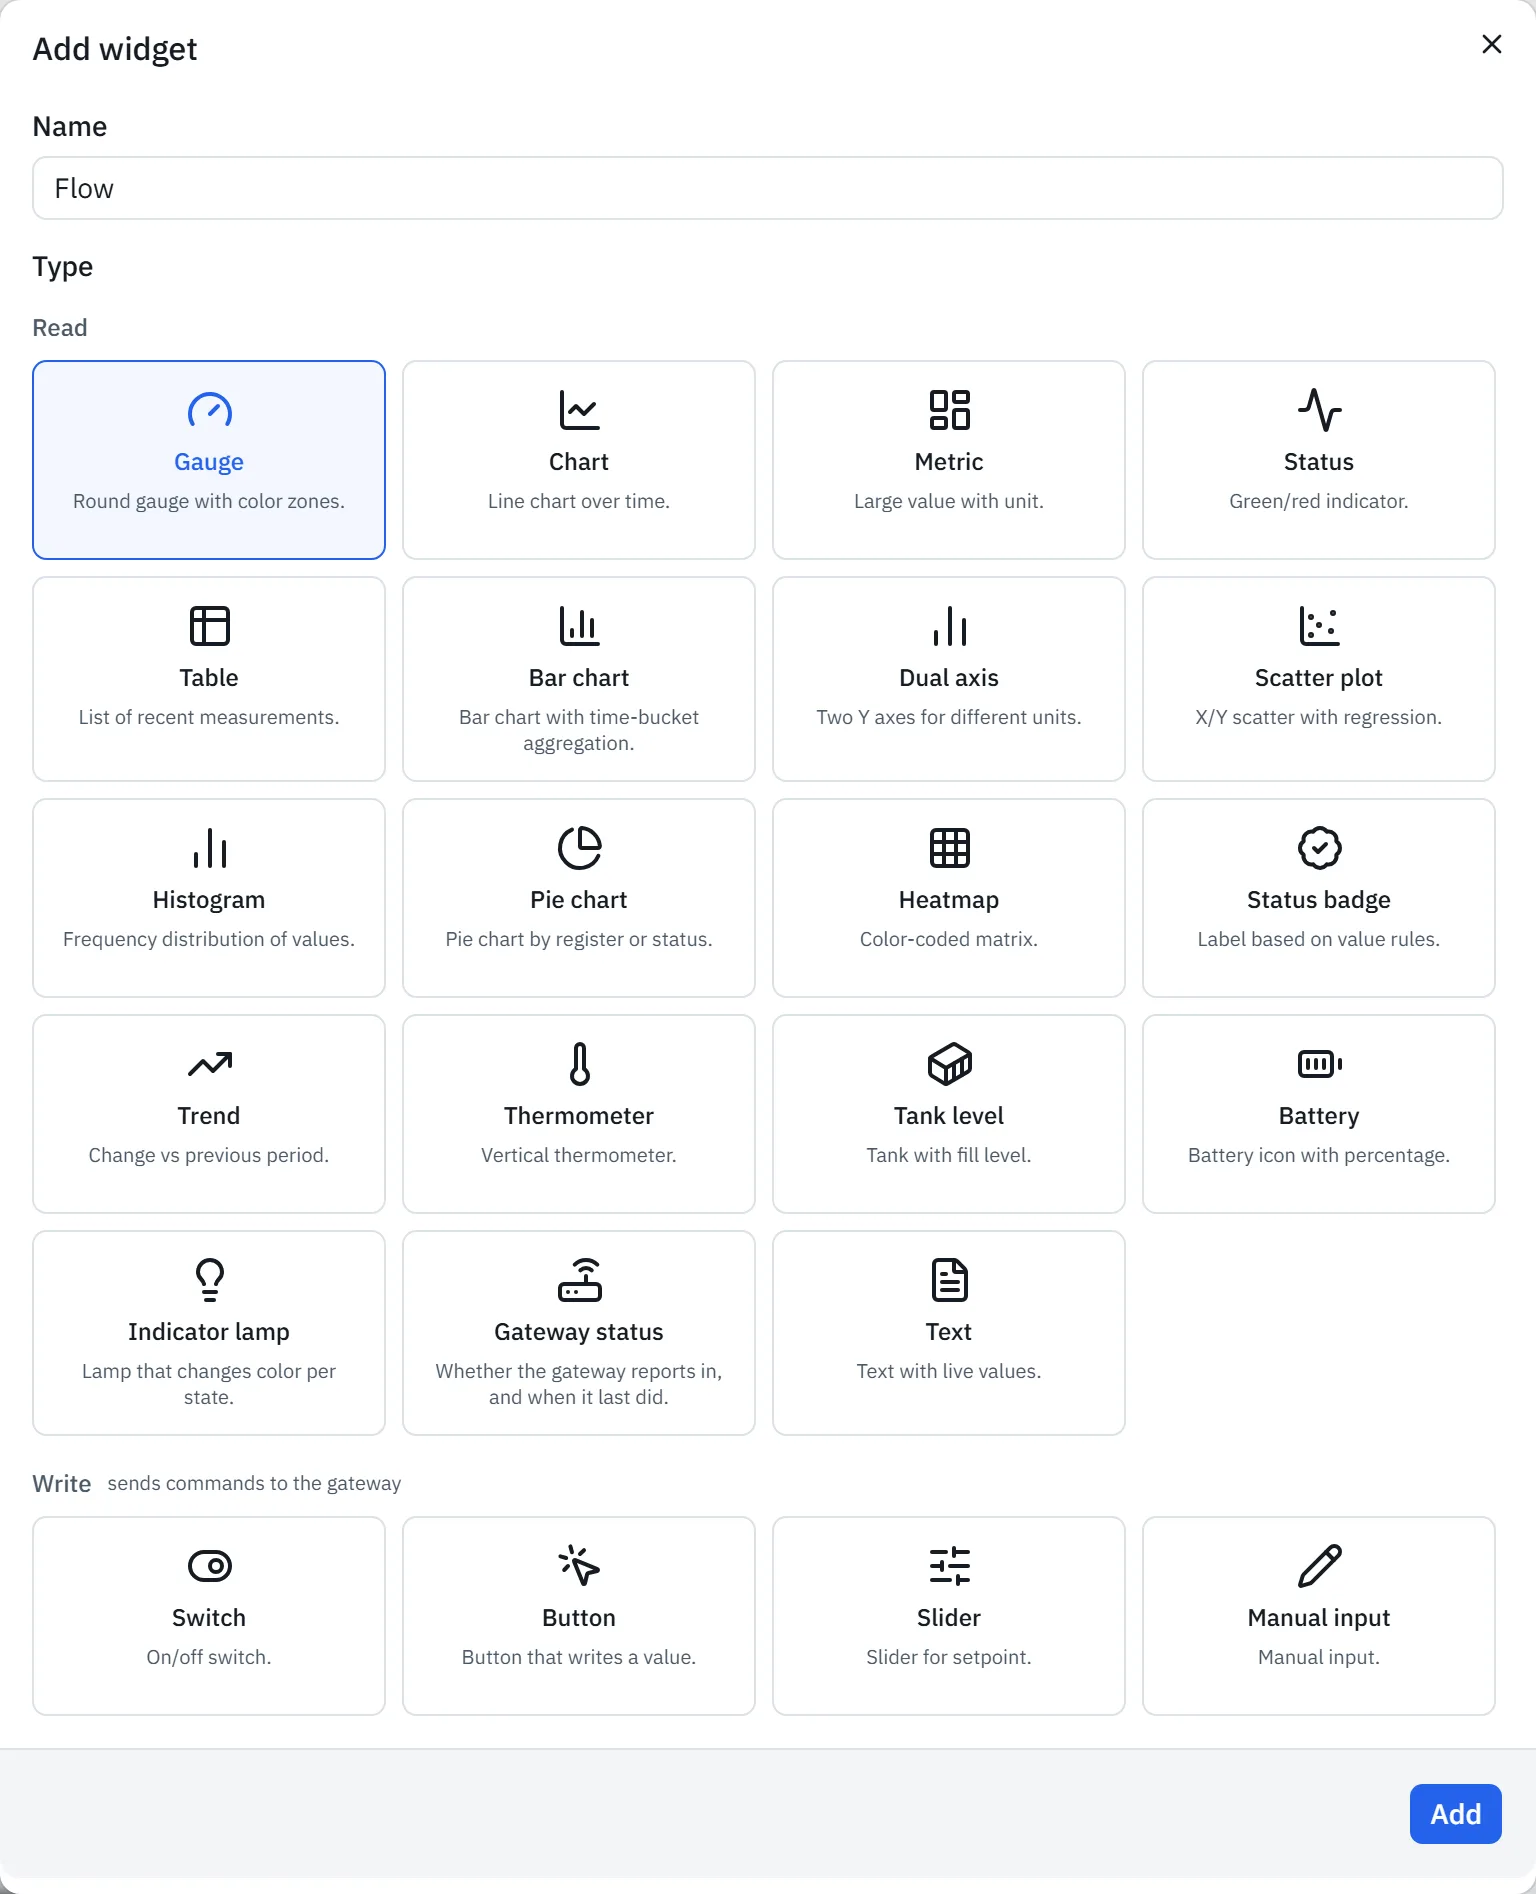
The table shows what each widget shows or does.
| Group | Widget | What it does |
|---|---|---|
| Charts | Chart | Lines for up to 10 registers. Shows the last 24 hours by default, which you can change in the widget from 1 hour to 30 days |
| Charts | Bar chart | Bars per hour, day, week or month, as average, minimum, maximum, sum or consumption from a meter reading |
| Charts | Dual axis | Registers with different units on a left and a right axis, as line, area or bar, over the last 24 hours |
| Charts | Scatter plot | Two registers plotted against each other, with readings from the same minute of the last 7 days |
| Charts | Histogram | Distribution of the readings of the last 7 days |
| Charts | Pie chart | Current values of up to 10 registers, or the number of gateways per status |
| Charts | Heatmap | Hourly values of the last 30 days in a grid, such as hour of the day against day of the week |
| Numbers and status | Metric | One large value with unit, red outside the thresholds |
| Numbers and status | Trend | Current value and the difference in percent compared with an hour, a day or a week ago |
| Numbers and status | Table | The last 8 readings of one register, with the time |
| Numbers and status | Status | Green or red dot. Without limits it is red at the value 0, with Lower limit and Upper limit it is red outside them |
| Numbers and status | Status badge | Text and colour according to rules that you create. If no rule matches, it shows the status label of the register |
| Numbers and status | Indicator lamp | Lamp with a colour per state, grey if no state matches |
| Numbers and status | Gateway status | Online, Offline or Unknown for one gateway, with the moment it last sent anything |
| Scales and levels | Gauge | Half round scale between minimum and maximum, 0 to 100 by default, with a mark at each threshold |
| Scales and levels | Thermometer | Vertical thermometer between minimum and maximum |
| Scales and levels | Tank level | Tank that fills between minimum and maximum, with a colour per level |
| Scales and levels | Battery | Percentage, with the minimum as 0% and the maximum as 100% |
| Text | Text | Your own text with formatting and live values |
| Controls | Switch | Writes the value for on or for off, 1 and 0 by default |
| Controls | Button | Writes one fixed value, 1 by default |
| Controls | Manual input | Writes a number that you type. The widget does not send a number outside minimum and maximum |
| Controls | Slider | Writes the position of the slider as soon as you hold it still for a moment |
In the Text widget, you place a live value with {{serienummer:adres}}. Enter the serial number of the gateway and the address of the register. For a Modbus device with slave address or unit ID 1, that is the address from the register list. For a higher number, you add that number multiplied by 10 000 to the address, so address 4 on slave address 3 becomes 30004.
A question mark in the text means that the portal cannot find the gateway or the register. It can also mean that this gateway has more than one register with that address.
Write values with control widgets
A control widget sends a value to a register of a Modbus device. The register field is then called Register to write to and only shows registers with Toegang (access) set to Lezen + schrijven (read and write). How to set that is described in Set up registers.
The widget only writes if all conditions in the table are met. The table shows which text appears in the corner of the widget when a condition is not met.
| Condition | Text in the widget |
|---|---|
| You have the role Owner, Admin or Technician. A team member with Read only never writes | No permission |
| The gateway is online | Gateway offline |
| Control is on for the gateway | Control off |
Control is off per gateway until ModbusCloud turns it on. How to request it is described in Control registers from the portal.
If a value must not change by accident, turn on Confirm first while you configure the widget. The widget then first shows the new value, and Confirm only works after 2 seconds.
Updated on 7 October 2026
Still stuck?
Email or call us. Include the serial number of the gateway, so we can take a look straight away.
Go to support