



All topics
On this page
Values and charts are on the gateway page, on the Overview and Trends tabs. Every team member sees them, including those with the role Read only. If the gateway has no Modbus device yet, first follow Add Modbus devices.
Open the values and the chart
Loading the walkthrough.
Open the gateway list
Open Gateways in the menu.
Open the gateway
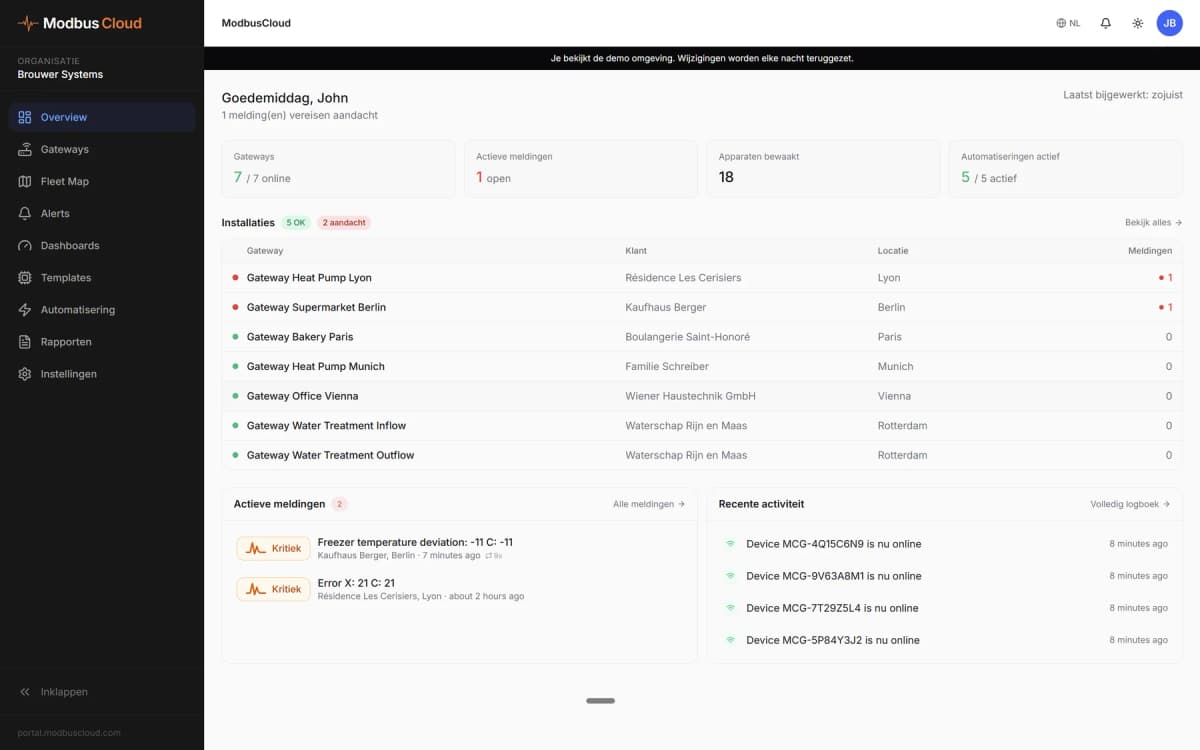
Click the gateway. The gateway page opens on the Overview tab, with one card per Modbus device.
Open Trends
Open the Trends tab. The chart shows the last 24 hours of a few preselected registers.
Open the register list
At the top right, click Select registers, the button with the number of chosen registers in brackets.
Select the registers
Select the registers you want to see in the chart. Each selected register gets a colour. If the gateway has more than one Modbus device, the registers are grouped per Modbus device.
Choose the period
Choose the period 1h, 6h, 24h, 7d or 30d. The chart loads the readings from that period up to now.
Read live values
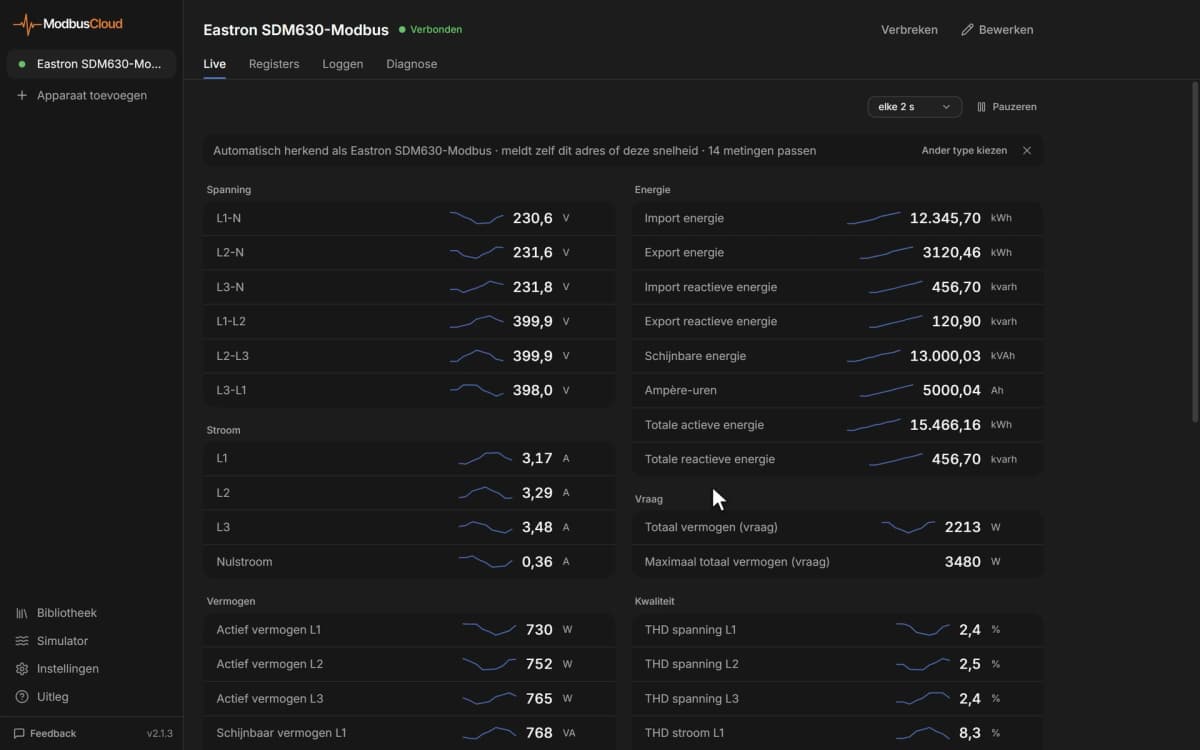
On the Overview tab, each card shows the registers of one Modbus device with their latest value. The values refresh by themselves as soon as a reading arrives, without reloading the page. You set how often that happens with Choose the polling interval.
If the register or the template knows the meaning of a status or error code, that text appears instead of the number. At the bottom of the card you see how long ago the Modbus device was last read.
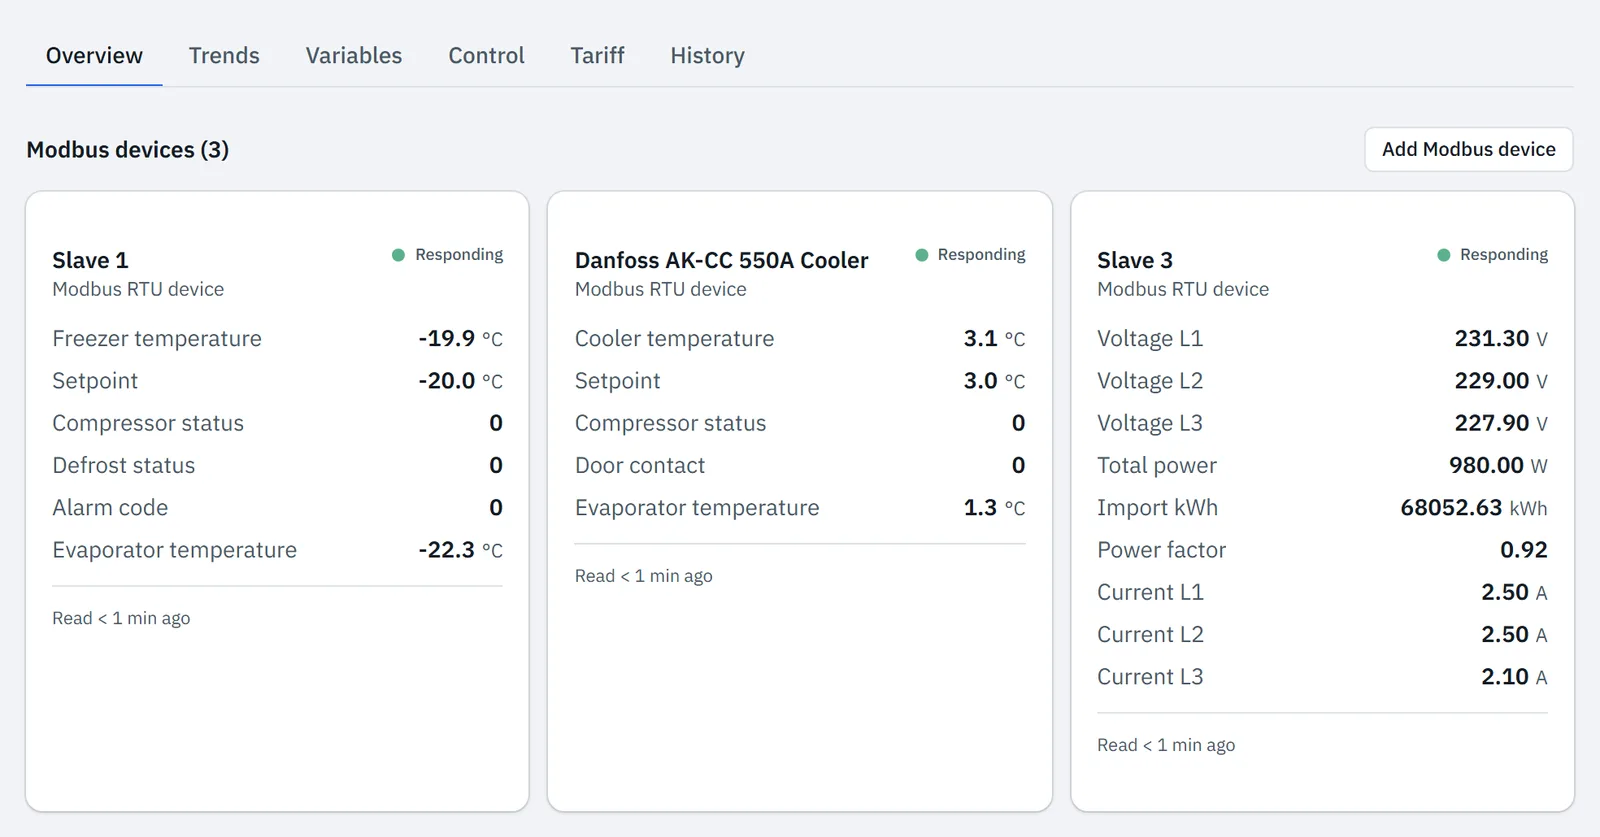
At the top right of the card is the status of the Modbus device, such as Responding or Timeout. If the gateway is offline or no reading has ever arrived, it shows Unknown.
Timeout means the gateway is online, but no reading from this Modbus device has arrived for too long. That limit is five times the polling interval, with a minimum of 15 minutes. What to check then is described in Modbus device shows no values.
Click a card to open the page of that Modbus device. It lists all registers in a table, with their latest value in the column Laatste waarde (last value).
Adjust the chart
In the chart you read single points, hide lines and zoom in on part of the period.
- Move the mouse over the chart. A window shows the time and the value of each register at that point.
- In the legend below the chart, click the name of a register to hide its line. Click again to bring it back.
- Drag the edges of the slider below the chart inwards. The chart then shows only that part of the period.
- Above the chart, click the coloured label of a register. The register disappears from the chart.
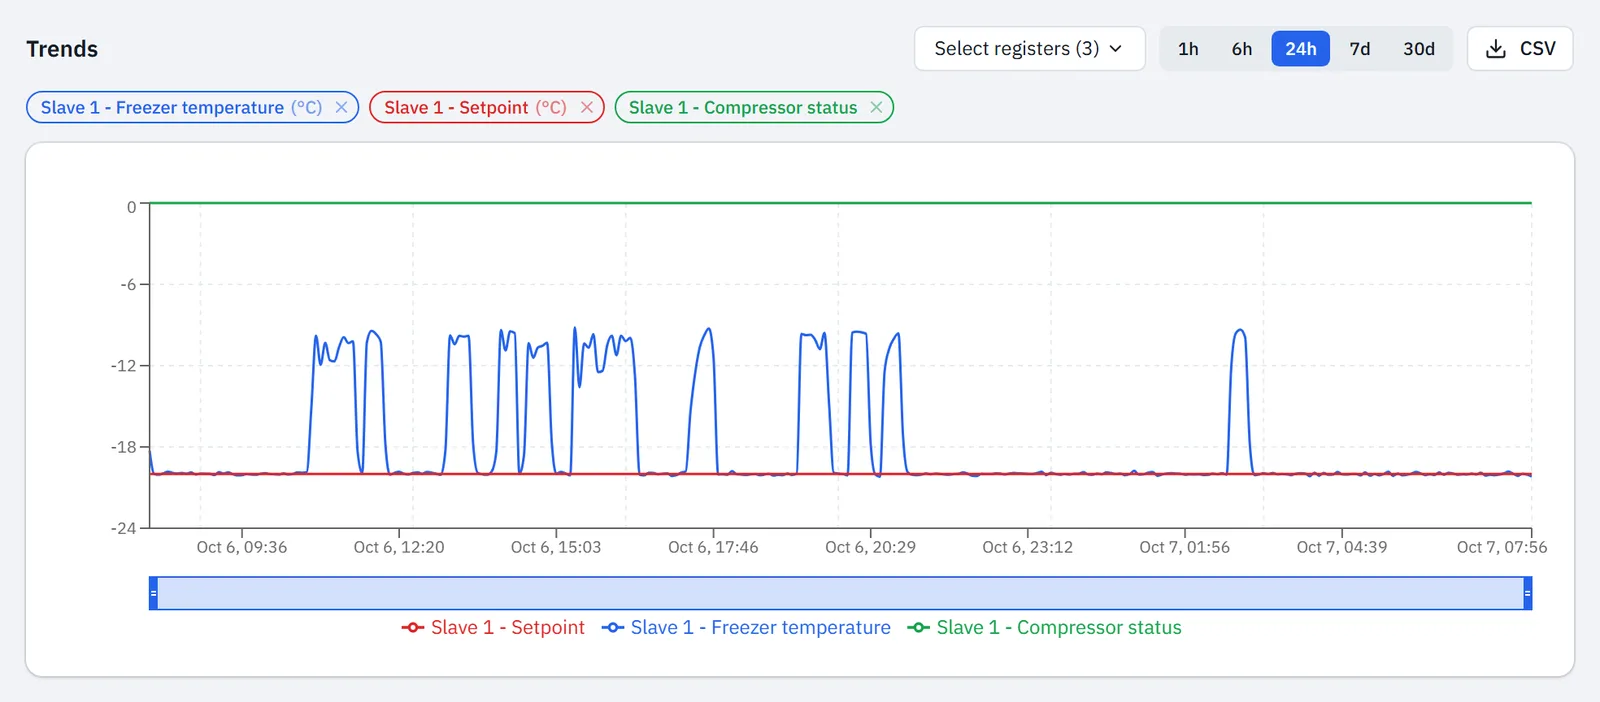
The chart does not follow new readings. It shows the period up to the moment you opened Trends or chose another period. The portal also does not remember your choice of registers. To keep a chart you view often, put it on a dashboard with Create a dashboard.
Detail per period
The history keeps at most one reading per minute per register, for 365 days. By default the gateway reads a Modbus device every 300 seconds (5 minutes). The history then holds one reading per 5 minutes.
From 24h the chart shows averages. The table shows what one point in the chart is.
| Period | One point in the chart |
|---|---|
| 1h, 6h | One stored reading |
| 24h | Average over about 5 min |
| 7d, 30d | Average per hour |
A short peak disappears in an average. A status register appears in the chart as a number, and from 24h as the average of those numbers. If you look for a peak or a status change, choose 1h or 6h.
Download the chart figures
At the top right, click CSV. The button appears as soon as the chart shows data. The file contains the points of all chosen registers over the whole period, even if you zoomed in or hid a line. From 24h these are therefore averages.
- The file name contains the period, such as
trends-24h.csv. - The first column is the time, in the time of your computer. Then comes one column per register with the name and the unit.
- If the gateway has more than one Modbus device, the name of the Modbus device comes before the name of the register.
- A comma separates the columns and a dot is the decimal mark, in every language.
If you want to edit the readings in Excel, or you look for a short peak from more than 6 hours ago, use Download readings. That file is formatted for Excel and contains the single readings of all registers on the gateway.
Updated on 7 October 2026
Still stuck?
Email or call us. Include the serial number of the gateway, so we can take a look straight away.
Go to support