



All topics
On this page
Diagnostics logs on your own computer, separate from the gateway and the portal. A session stays on the computer until you delete it. If you remove the Modbus device from Diagnostics, you no longer see its sessions either. You get the history of a gateway from the portal, as in Download readings.
What you need
- ModbusCloud Diagnostics on your computer, as in Install ModbusCloud Diagnostics.
- For logging, a Modbus device that you have added in Diagnostics, as in Connect and find a Modbus device with Diagnostics.
Log values
After these steps, a session with all the values read is listed under Sessions. By default, Diagnostics logs all readable registers of the device type, except the settings of the Modbus device.
Open the Modbus device
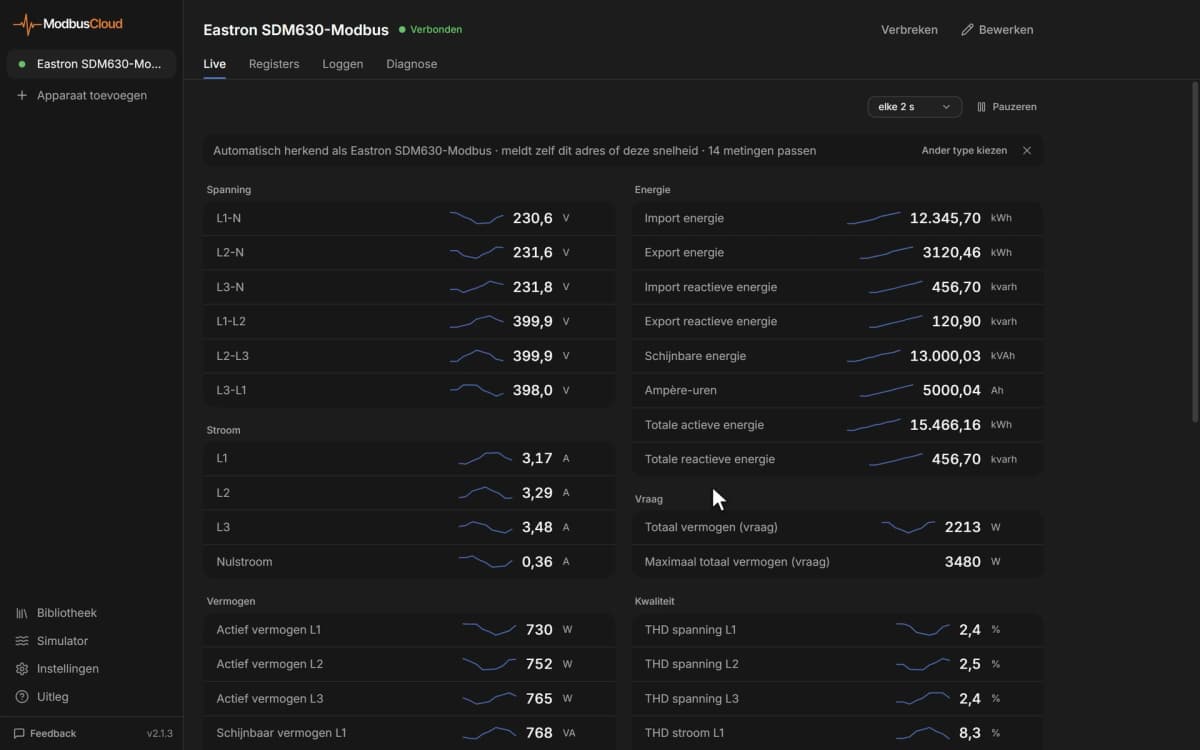
Click the Modbus device in the sidebar on the left.
Open the tab
Open the Log tab.
Choose the interval
In the list, choose how often Diagnostics reads, from every 250 ms to every 60 s. The default is every 1 s.
Open the selection
Click Adjust.
Enter a name
If you want to recognise the session later, enter a name in the name field. If you leave the field empty, the session is called Log session 1, Log session 2 and so on.
Choose the registers
Under What to log?, select the registers that you want to log. All and None turn all checkboxes on or off at once.
Keep changes only
To save space in a long session, turn on Log on change only. Diagnostics still reads at the interval, but it stores a value only if it differs from the previous one.
Start logging
Click Start logging. At the top, Logging now appears, with the number of readings, the duration and a live chart. The session appears under Sessions with a red dot.
Stop logging
Click Stop logging. Diagnostics stops reading and the session stays under Sessions.
Logging continues as long as Diagnostics is open, even if you open another tab or Modbus device. If you click Disconnect or change the connection settings of the Modbus device, the session stops. Only one session runs at a time per Modbus device.
If the Modbus device has no device type, there are no registers to select. After Adjust, the table under Advanced appears straight away. Use Add register there to add registers yourself, with name, type, address, data type, byte order, scale and unit. How Diagnostics determines the device type is described in Identify a Modbus device, read and write values.
View or delete a session
Under Sessions, each session is listed with name, start time, duration, interval and the number of readings. A Δ after the interval means that the session stored changes only.
Click the eye in the session row (View) to open it. You see a chart and, for each register, the columns Readings, Errors, Min, Avg, Max and Last.
You delete a session with the bin (Delete session). This is not possible while the session is running.
Export a session
You save a session as a CSV or JSON file. The table shows what each format gives you.
| Choice | Layout | Suitable for |
|---|---|---|
| CSV for Dutch Excel (semicolon, comma) | Semicolon between the columns, decimal comma | Excel with Dutch settings |
| CSV (comma, dot) | Comma between the columns, decimal point | Excel with English settings and other software |
| JSON | Each reading separately, with the raw register values | Your own scripts and checking the byte order |
Open the export menu
Click the download icon in the session row (Export).
Choose the format
Choose the format.
Save the file
Save the file in the folder of your choice. Diagnostics reports how many rows it has exported.
The CSV file starts with the column timestamp, with date and time in the local time of your computer, down to the millisecond. The column ts_ms gives the same moment as Unix time in milliseconds.
After that, each register has its own column, with the unit in square brackets, such as Voltage L1 [V]. The scale has already been applied.
Registers from the same read round share a row. With Log on change only, a cell is empty if the value stayed the same. If reading a register failed, the cell contains a # with the error message, such as #timeout.
The JSON file contains the session with the logged registers under session and each reading separately under samples. For each reading, it also holds the raw register words in hex, under raw.
Export a device type
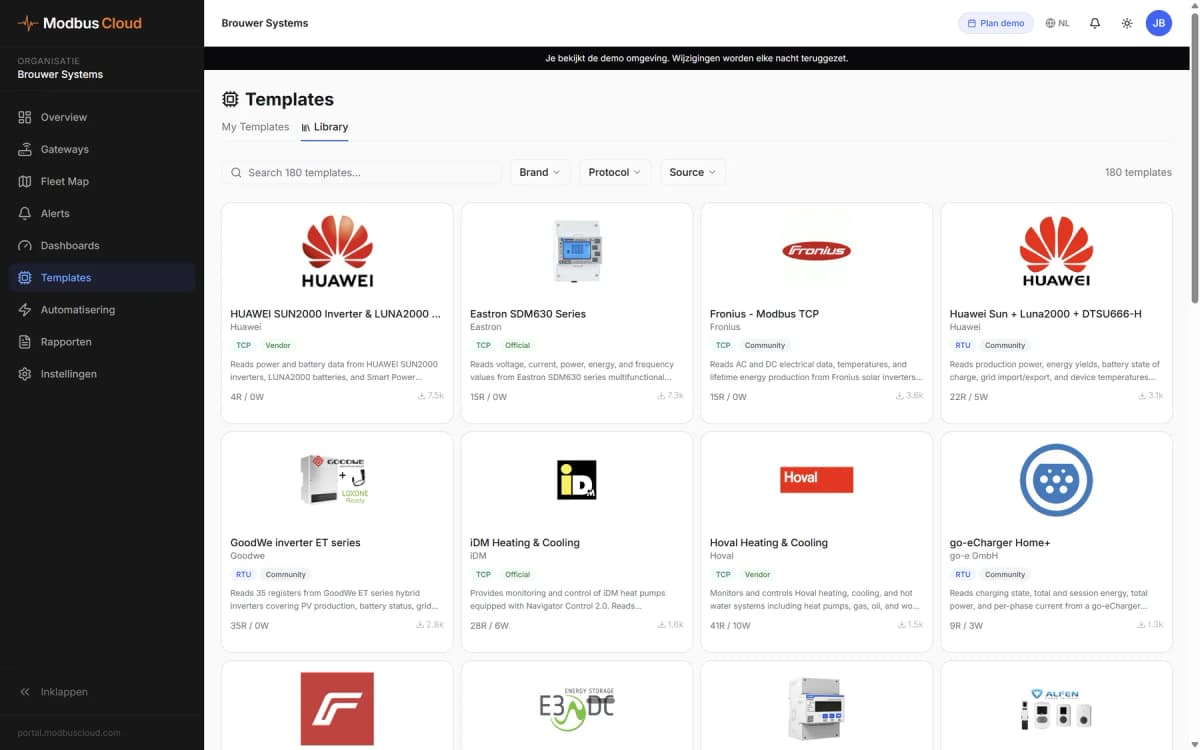
Diagnostics converts a device type from the library into a file for other software. The file comes from the library and not from the connected Modbus device. In the library, a device type is called a template.
The table shows which format belongs to which software.
| Choice | Purpose |
|---|---|
| JSON (this app) | Read the device type into Diagnostics on another computer, with the upload icon (Import JSON) in the library |
| Home Assistant YAML | A modbus: block for the Home Assistant configuration |
| ESPHome YAML | An ESPHome configuration with uart, modbus and modbus_controller |
| ModbusCloud gateway JSON | A template in the portal |
| CSV | The register list with one line per register, separated by semicolons, with the address counted from 0 and from 1 |
Open the library
Click Library at the bottom left of the sidebar.
Find the device type
In the search field, enter a brand, model or keyword. If you are looking for a device type that you made yourself, such as in import a manual, choose Mine.
Open the device type
Click the device type in the list. The default settings and the registers appear on the right.
Open the export menu
Click Export as.
Choose the format
Choose the format.
Save the file
Save the file in the folder of your choice. Diagnostics reports where the file is.
Complete the Home Assistant and ESPHome file
The file takes over the default settings of the device type, such as slave address, baud rate, parity and stop bits. What Diagnostics does not know, such as the IP address or the serial port, is in the file as an example value. You replace those yourself.
The table shows which lines you check or fill in.
| File | Line | What you enter |
|---|---|---|
| Home Assistant, Modbus TCP | host | The IP address of the Modbus device instead of the example address |
| Home Assistant, Modbus TCP | port | The port, if it differs from the default of the device type |
| Home Assistant, Modbus RTU | port | The serial port of your RS485 adapter instead of /dev/ttyUSB0 |
| Home Assistant | slave | The slave address, if it differs from the default. It is set for each register |
| ESPHome | tx_pin, rx_pin | The pins of your RS485 module instead of GPIO17 and GPIO16 |
| ESPHome | address | The slave address under modbus_controller |
The Home Assistant file sets scan_interval: 10 for each sensor, the ESPHome file update_interval: 10s. If you want a different interval, change that value. For a register with byte order BADC or DCBA, Diagnostics adds a comment in the ESPHome file that ESPHome does not support that order.
Home Assistant and ESPHome read the Modbus device themselves with this file. The gateway and the portal take no part in this. For how Home Assistant reads Modbus, see Home Assistant Modbus integration in the knowledge base.
Use a device type as a template in the portal
With ModbusCloud gateway JSON, a device type becomes a template in the portal. The file has the same structure as an export from Templates. Read it in with Import on the page of a template and then click Save, as in Create a custom template.
You set the address and connection in the portal when you add the Modbus device. The gateway reads the data types int16, uint16, int32, uint32 and float32. After Import and before Save, check the Protocol and the data type of each register.
Updated on 7 October 2026
Still stuck?
Email or call us. Include the serial number of the gateway, so we can take a look straight away.
Go to support