


All topics
On this page
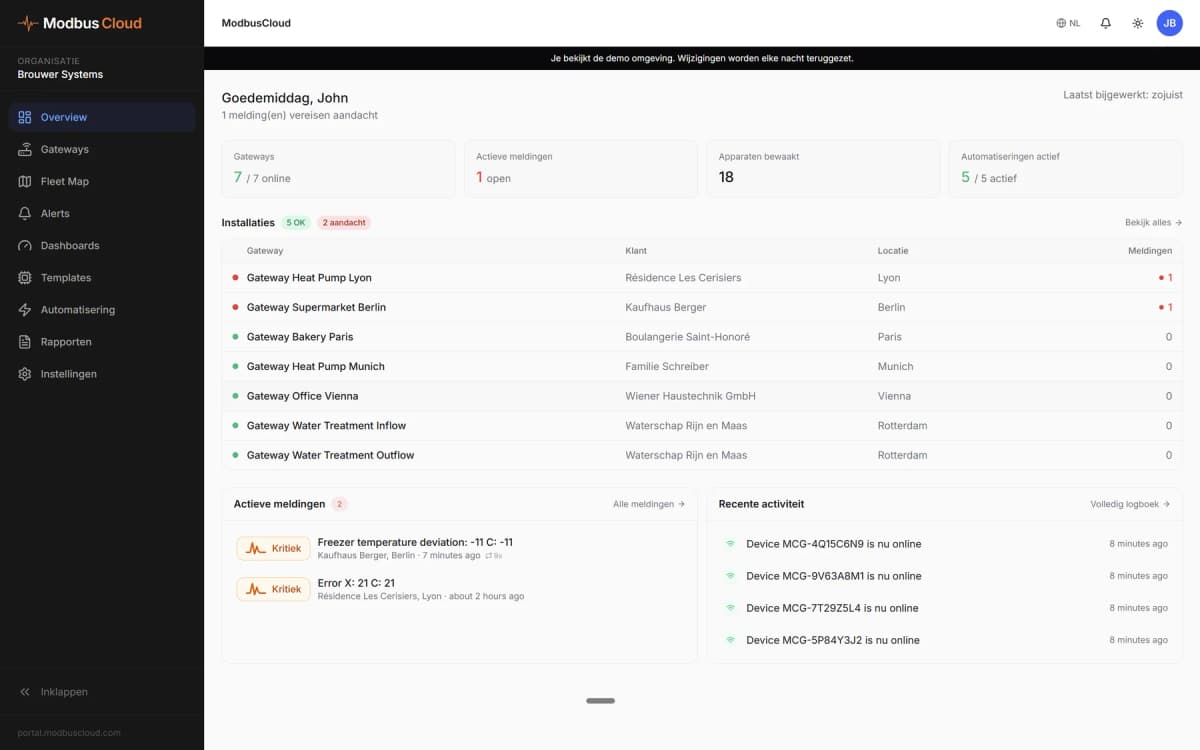
You open the gateway page by clicking a gateway in Gateways. The buttons and tabs you see depend on your role and on the registers of the gateway.
The header
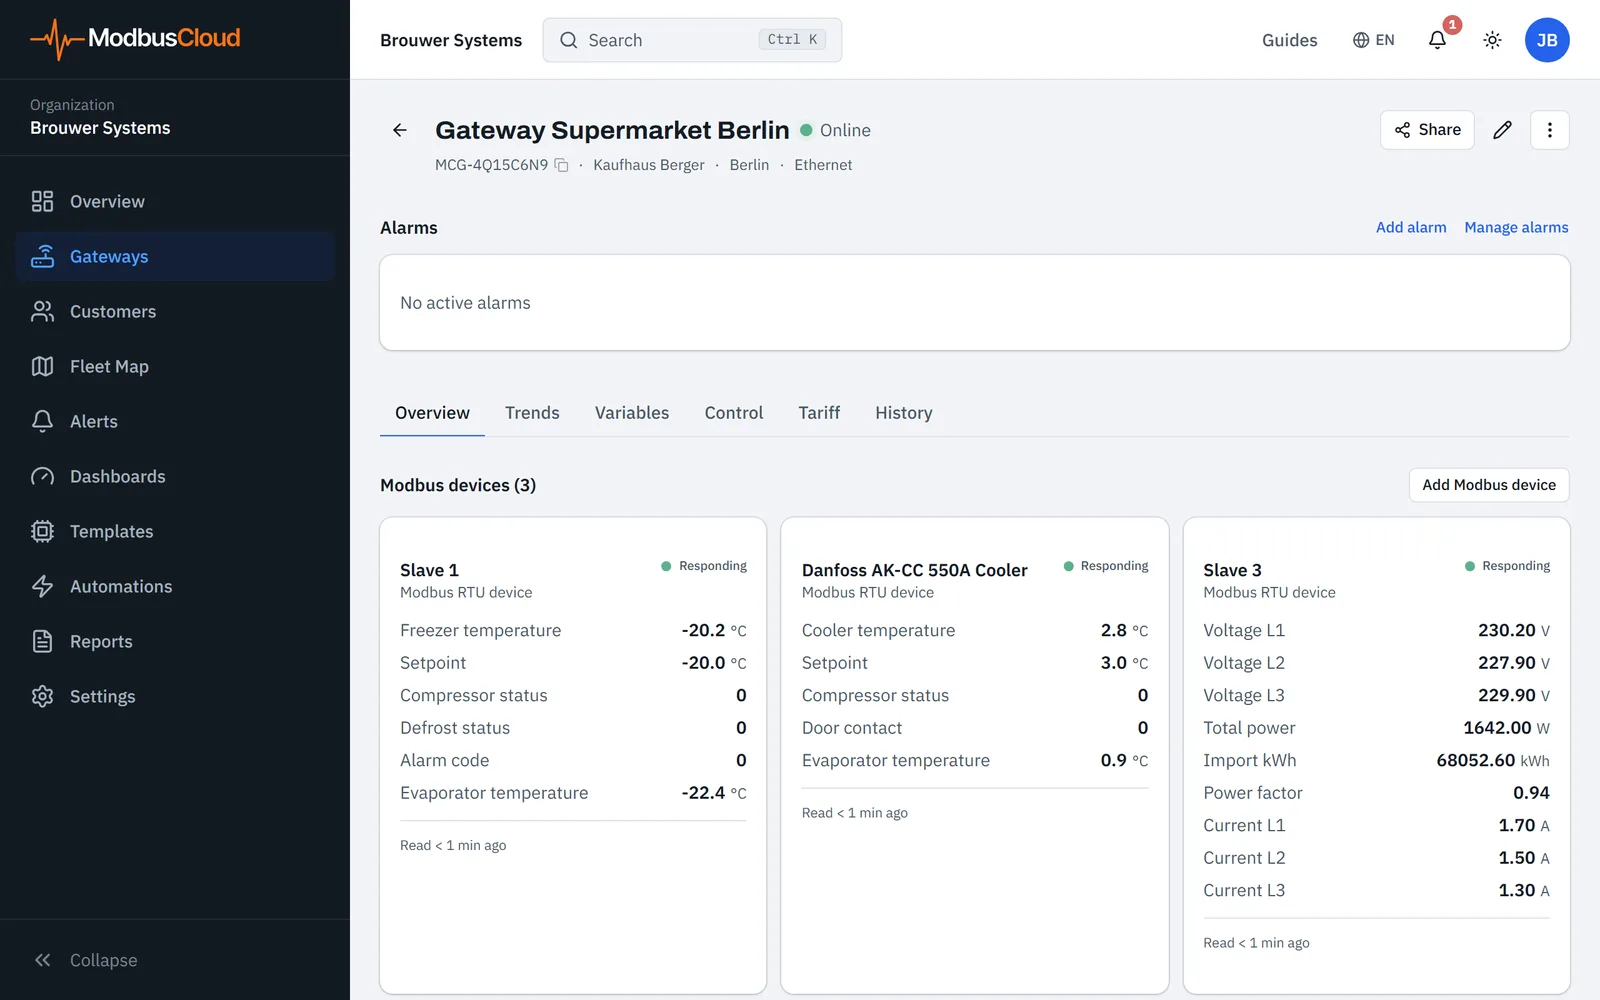
The header shows the name of the gateway and its status, Online, Offline or Pending. With Offline, it also shows how long ago the gateway last sent anything.
Below the name you see the serial number, the customer and the location. Click the serial number to copy it. Click the customer to open the customer page.
On the right side of the header are the pencil (Gateway settings) and the menu with the three dots. You see the pencil as an owner, admin or technician.
The pencil opens the settings of the gateway, such as the name, the RS485 bus and the SIM interval. What you set there is covered in Gateway settings.
The menu
The table shows what the choices in the menu with the three dots do.
| Choice | What it does | For whom |
|---|---|---|
| Download readings | Downloads the readings of all registers as a CSV file, for the last 7 days, 30 days, 12 months or the whole history | Everyone who can open the gateway |
| Export configuration | Downloads the Modbus devices, registers and alert rules of the gateway as a JSON file | Owner, admin and technician |
| Decommission gateway | Removes the gateway from your organisation | Owner only |
What the CSV file looks like is covered in Download readings.
On a phone or in a narrow browser window, the pencil and the menu are not there. The bar at the top then shows a download icon (Download readings) and a gear (Gateway settings). Export configuration is only available on a large screen.
The alert bar
The alert bar sits above the tabs, so you see an open alert on every tab. The bar shows the last ten alerts of this gateway that are not resolved yet.
Each alert shows how long ago it fired and its status, Open, Acknowledged or Returned. Returned means the value is back to normal, but nobody has resolved the alert. For an open or acknowledged alert, the colour of the icon shows the severity. Red is critical, orange is warning and blue is info.
An owner, admin or technician acknowledges an open alert with Acknowledge. Resolved alerts are under Alerts in the menu, where you can also handle an alert.
Above the bar are Add alarm and Manage alarms. A team member with the role Read only does not see these two buttons. Add alarm opens a new alert rule with this gateway already filled in. Manage alarms opens the list of alert rules, filtered on this gateway.
How to build a rule is covered in Create an alert rule.
The tabs
Control and Tariff only appear when the registers call for them. The table shows what each tab displays and when it is there.
| Tab | What you see | When it is there |
|---|---|---|
| Overview | A card for each Modbus device with the latest value of each register | Always |
| Trends | The history of chosen registers in a chart, from the last hour to 30 days | Always |
| Variables | Values that the portal calculates from registers with a formula | Always |
| Control | Write values to registers once control is on for this gateway, with the Command history below. With the role Read only, you only see the Command history | When at least one register is set to Lezen + schrijven (read and write) |
| Tariff | Peak and off-peak tariff per kWh meter | When a register has the unit kWh |
| History | The log of the gateway | Always |
How to use the tabs is covered in View values and charts, Calculate values with variables, Control registers from the portal and Set up peak and off-peak tariffs per kWh meter.
Overview
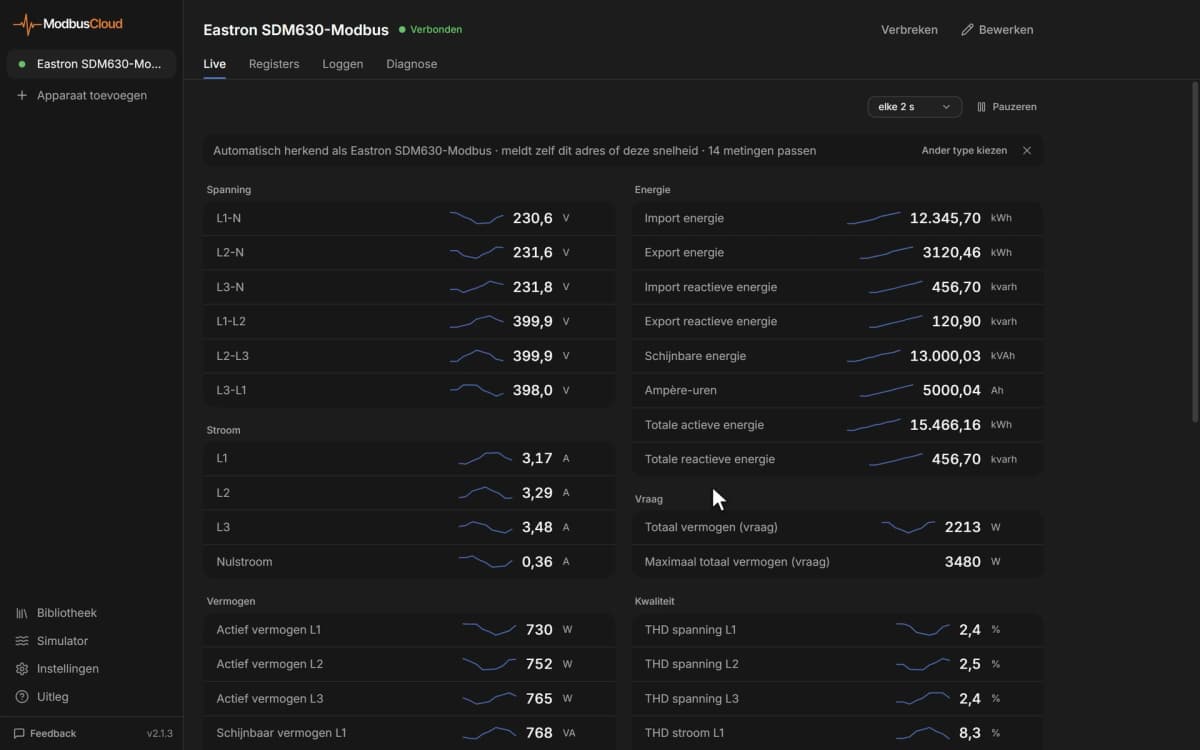
The page opens on Overview. Each card shows the name and type of the Modbus device, with the status at the top right. At the bottom of the card you see how long ago the latest reading arrived.
The table shows what the status on a card means.
| Status | Meaning |
|---|---|
| Responding | The gateway is online and the Modbus device delivers readings |
| Timeout | The gateway is online, but the Modbus device delivered no reading for longer than 5 times the polling interval, with a minimum of 15 minutes. The card shows since when |
| Unknown | The gateway is offline, or the Modbus device has never delivered data |
Click a card to open the Modbus device with its registers and connection. Above the cards is Add Modbus device, for an owner, admin or technician. How that works is covered in Add Modbus devices.
History
History does not show readings. It shows when the gateway was linked to your organisation and when someone changed the automatic monitoring of the gateway. The newest event is at the top.
Values that were written to a register are under Command history on Control.
Who gets emails for alerts
At the bottom of the page is the block Who gets emails for alarms. Team members appear in it with a switch. Separate email addresses and the addresses from the notification settings of the organisation appear in it as well.
You turn your own switch on or off yourself. An owner or admin also turns others on or off and adds separate addresses. How to choose recipients is covered in Choose who receives alert emails.
Updated on 7 October 2026
Still stuck?
Email or call us. Include the serial number of the gateway, so we can take a look straight away.
Go to support