



All topics
On this page
The menu is the same for every team member. Which buttons you see on a page depends on your role. What each role can do is described in Team members and roles.
The menu
On a computer the menu is on the left. The table shows what you find under each item.
| Menu item | What you find there |
|---|---|
| Overview | The state of your gateways and the alerts that are not yet resolved |
| Gateways | All your gateways, each with its Modbus devices, values and settings |
| Customers | Your customers with address, contact person and gateways |
| Fleet Map | Your gateways on a map, with their status |
| Alerts | The alerts of all your gateways in the tabs Open, Acknowledged and Resolved |
| Dashboards | Your own screens with widgets, which you can also share with a link |
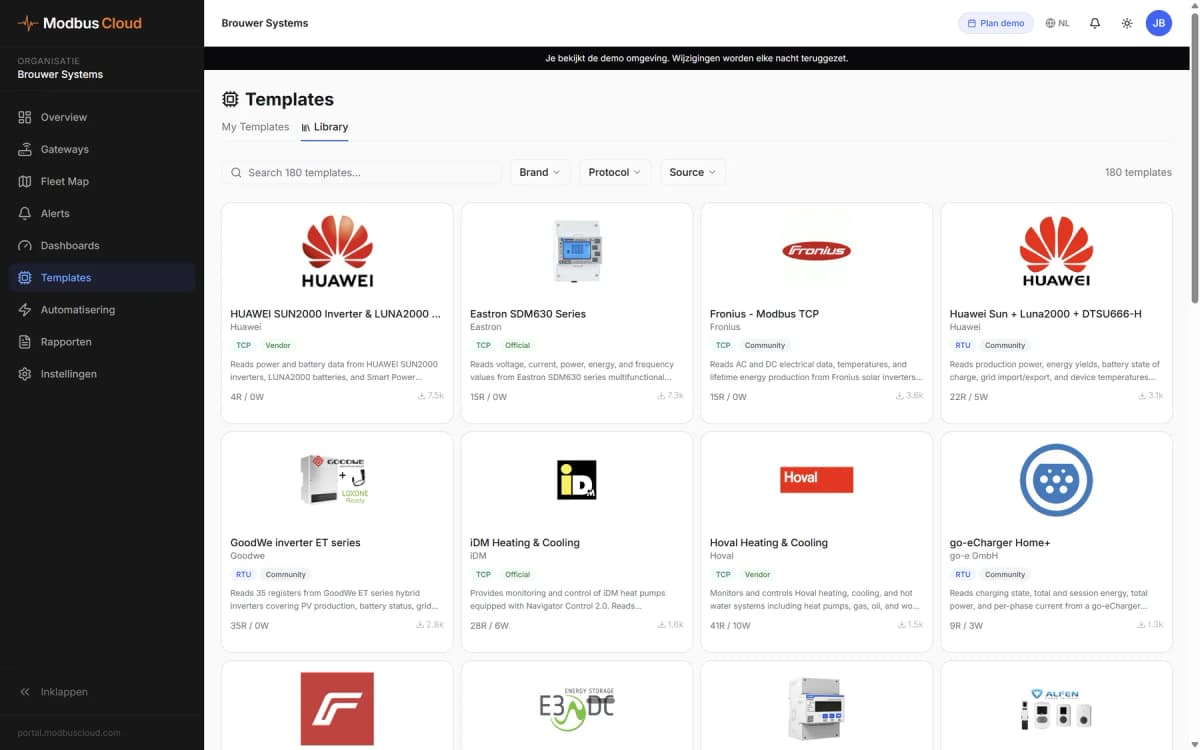
| Templates | The custom templates of your organisation and the template library |
| Automations | Rules that write a register themselves, send an email or call a webhook |
| Reports | Reports with charts and tables, one-off or scheduled |
| Settings | Among others Organization, My profile and Notifications |
With Collapse at the bottom of the menu, only the icons remain. On a phone or in a narrow window the menu is at the bottom, with Overview, Gateways, Alerts and More for the rest.
Overview
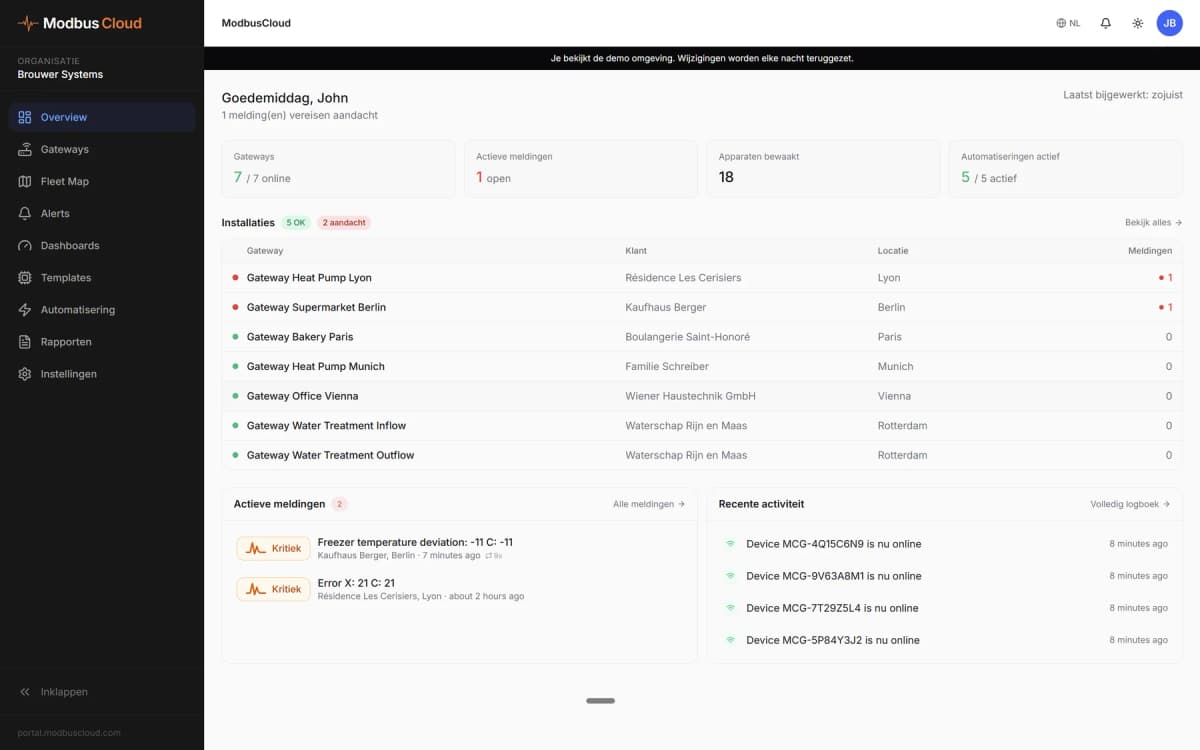
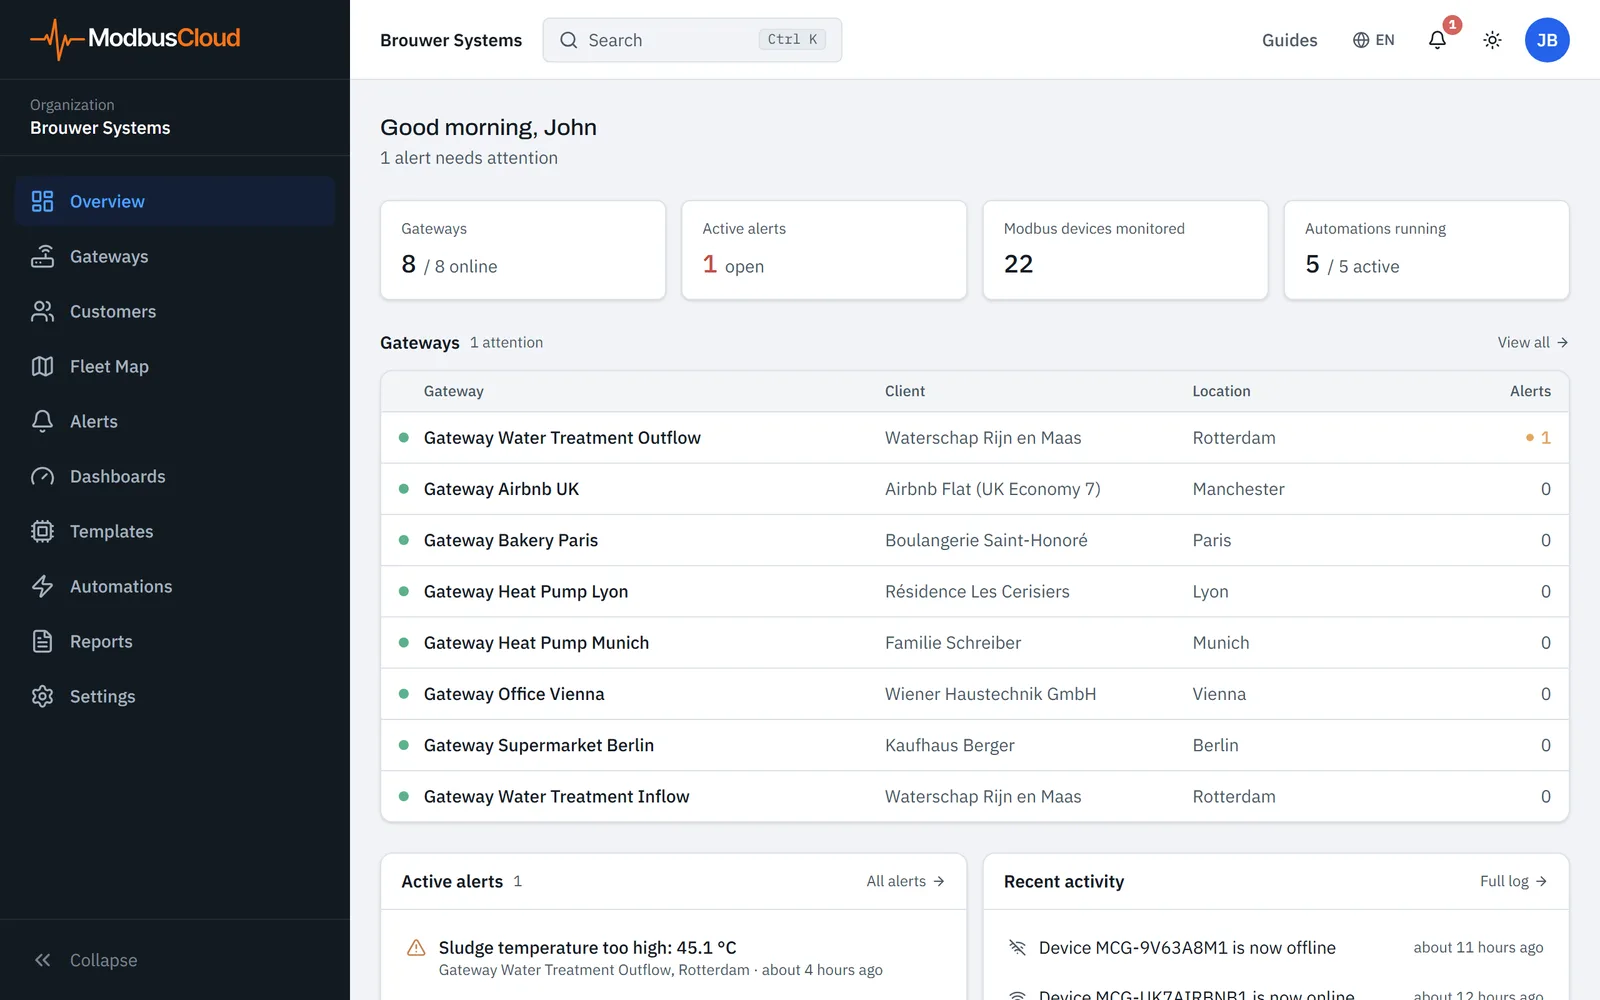
Overview shows on one screen whether anything needs attention. At the top it says whether everything works, how many gateways are offline and how many alerts need attention. The table shows the blocks below it on a computer, from top to bottom.
| Block | What it shows |
|---|---|
| Key figures | Gateways (online out of the total), Active alerts, Modbus devices monitored and Automations running |
| Gateways | Each gateway with customer, place and the number of alerts. Offline gateways and gateways with an alert are at the top |
| Active alerts | The four latest alerts that are not yet resolved |
| Recent activity | The four newest messages that a gateway went online or offline |
An alert counts as active until it is resolved, even if it has already been acknowledged. How that works is described in How alerts work. Click a gateway in the list to open the gateway page.
On a phone or in a narrow window, Overview shows tiles with key figures and Recent activity below them, without the list of gateways.
If your organisation has no gateway yet, Overview shows the message No gateways yet with the button Add gateway. Users who can only read do not see that button.
The top bar
The top bar is above every page. The table shows what it contains, from left to right.
| Item | What it does |
|---|---|
| Name of your organisation | Switches organisation if you are a member of more than one |
| Search | Opens the search window |
| Guides | Shows the guides for this page and All guides |
| Globe with language code | Sets the portal to Nederlands, English or Deutsch |
| Bell | Shows the latest alerts, with a red number for what is still unread in your organisation. Click an item to open the alert |
| Sun or moon | Switches between a light and a dark theme. This browser remembers your choice |
| Circle with your initials | Contains My profile, Settings and Sign out |
On a phone, Guides and Dark theme or Light theme are in the menu under your initials. Search is not available there. You choose the language of emails about your account separately in Preferred language. How to do that is described in Set up your organisation and profile.
Search with Ctrl K
Ctrl K opens the search window on every page, on a Mac Cmd K. Type part of a name, serial number or place. Every word you type must appear in the result.
The results are grouped for gateways, customers, Modbus devices, pages and guides. You can also find a gateway by the name or place of its customer. You can also find a Modbus device by the name or serial number of its gateway. Choose a result to open it.
Play a guide
A guide is a short animation that moves through the screens of the portal, with a short text at each step. Users who can only read see only the guides View values and charts and Handle an alarm.
Open the guides menu
In the top bar, click Guides.
Choose a guide
Choose a guide for this page. If it is not listed, choose All guides and find it in the list.
Go through the steps
Click Next or use the arrow keys.
Try it yourself
If you want to do it yourself right away, click Try it yourself after the last step. The portal opens the page where you start.
Gateways on the fleet map
Fleet Map places every gateway at the address of its customer. Filter the pins with All statuses and All customers above the map. Click a pin to see the status, the customer, the Modbus devices and the active alerts of that gateway on the right. The button Open gateway is there too.
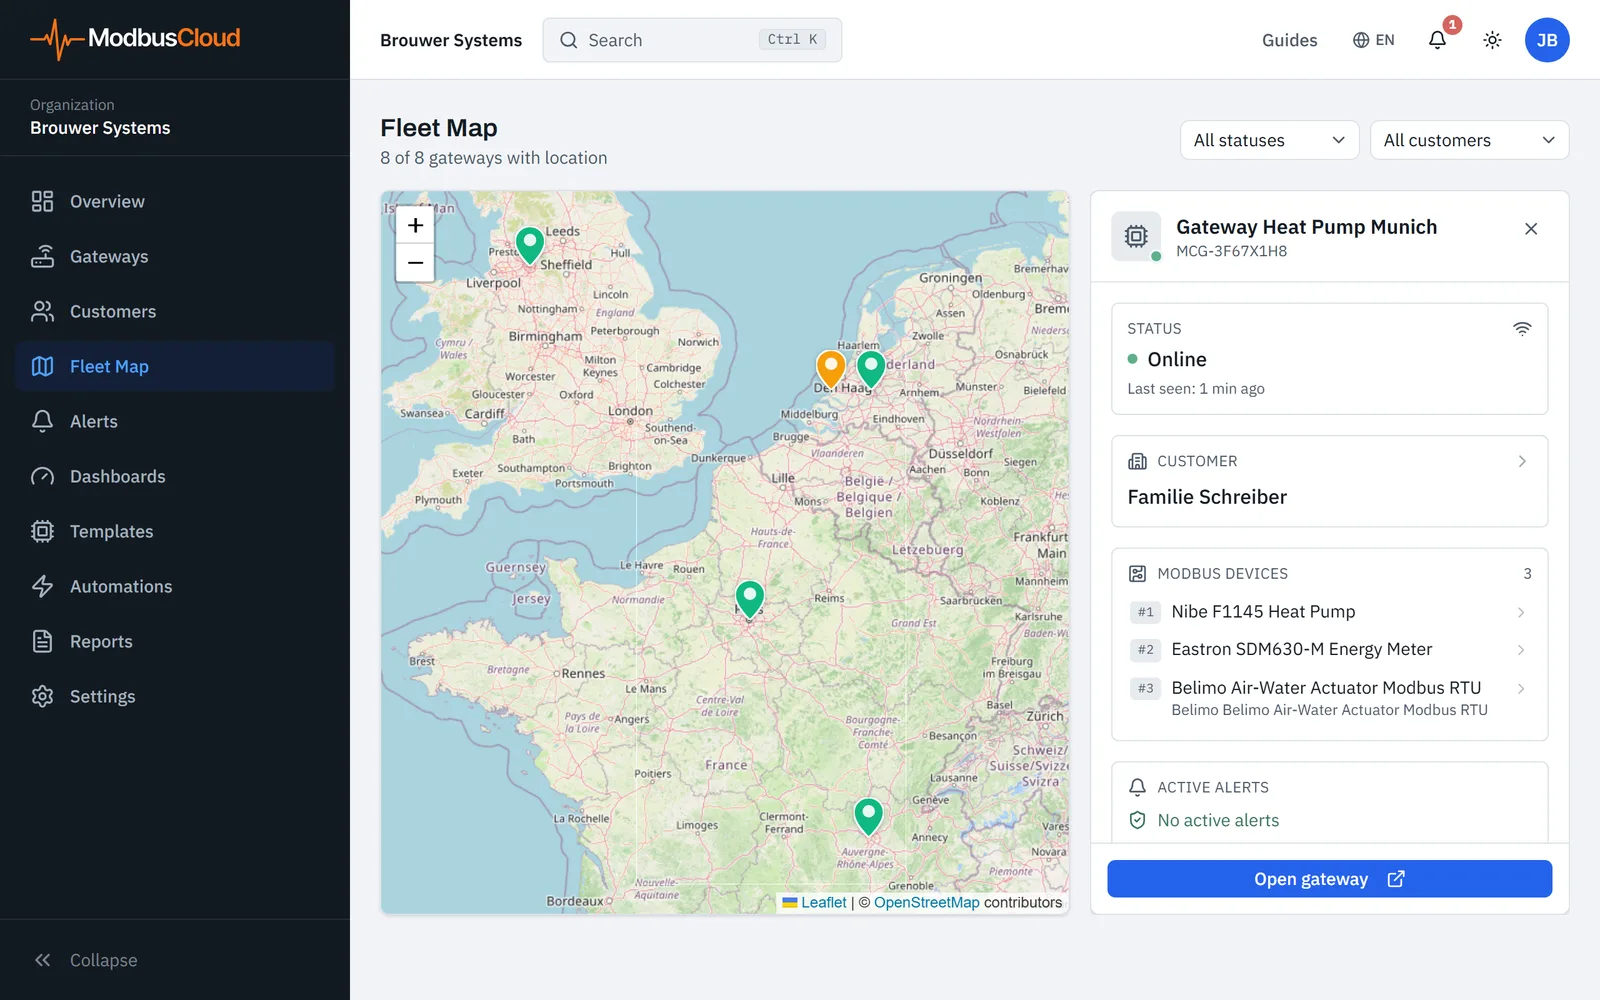
The colour of a pin follows the status and the alerts of the gateway.
| Colour | Meaning |
|---|---|
| Green | The gateway is online and has no warning or critical alert that is not yet resolved |
| Grey | The gateway is offline, even with an alert that is not yet resolved |
| Orange | The gateway is waiting for a connection, or has a warning that is not yet resolved |
| Red | The gateway has an error, or has a critical alert that is not yet resolved |
Send feedback
On a computer there is a round button with a speech bubble at the bottom right. Use it to report an error or to send ModbusCloud an idea or question about the portal. How to send a message with a screenshot is described in Get help.
If the button is in the way, drag it aside. This browser remembers the new position. On a phone or in a narrow window the button is not available.
Updated on 7 October 2026
Still stuck?
Email or call us. Include the serial number of the gateway, so we can take a look straight away.
Go to support